
Gummies, capsules, tablets, and other “Edibles”
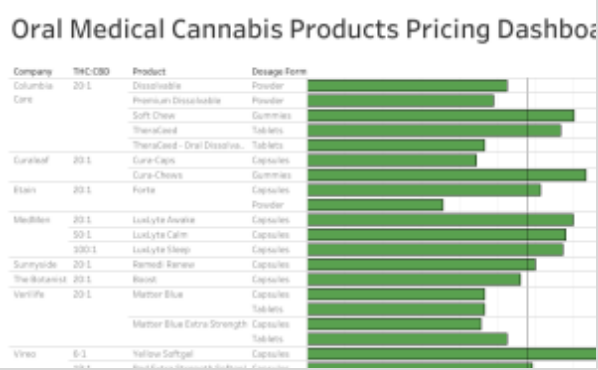
Our first visualization covers oral medical cannabis products available in NYS. The concept for this visualization came from wanting to know more about how costs differ between capsules, tablets, gummies, and other dosage forms. The large differences in (EQ) price that are seen may be the result of increased production costs associated with certain dosage forms. Gummies for instance, are notoriously cumbersome to produce.
Data sources
Product costs and total cannabinoid content were obtained from Leafly.com, Iheartjane.com, and the following company websites: col-care.com, etainhealth.com, fpwellnesssny.com, vireohealth.com/ny, medmen.com, shopbotanist.com, and ny.curaleaf.com.
How we created our dataset
1. Compiled product information using the sources above.
2. Created visualization using Tableau Prep.
How to interact with our dashboards
To interact with our dashboards, first, select whether you want to compare products based on the price per mg of THC or CBD. If you’re comparing products with a 1:1 THC:CBD ratio, then you can skip this step (price per mg of THC/CBD will be equal). Next, select if you want to filter for products that are higher in THC or CBD content using the check boxes (the default selection is for products higher THC). Next, select if you want to filter for different dosage forms (the default setting is all dosage forms). The green bars represent the product’s price per mg THC/CBD. Hover over the bars to view additional product data such as price per dose and ingredients. The line represents the average price per mg for the data you’ve selected. To learn more about how we assembled our first EQ pricing dashboard (which covers only oral products available in NYS) view our dedicated dashboard page and feel free to interact with the dashboard’s data! Still confused? Ask us a question.
Step by step
- Choose price per mg of THC or CBD from the drop-down menu.
- Filter for predominant cannabinoid preference THC, CBD, or equal (1:1).
- Filter dosage forms (if desired) and hover over bars for more details.
- For more details about how to use our dashboards click here.
EQ Pricing Oral Products (NY)

